After almost 30 years of consulting with leading companies on sales effectiveness and sales compensation, I’ve come to the conclusion that other than calling every sales compensation plan “commissions”, the most misunderstood and mis-applied concept in sales compensation is CCOS, compensation cost of sales. In this blog, we will examine what is CCOS and why should a company look internally rather than externally when using this important metric.
What is CCOS and Why Should a Company Look Internally rather than Externally?
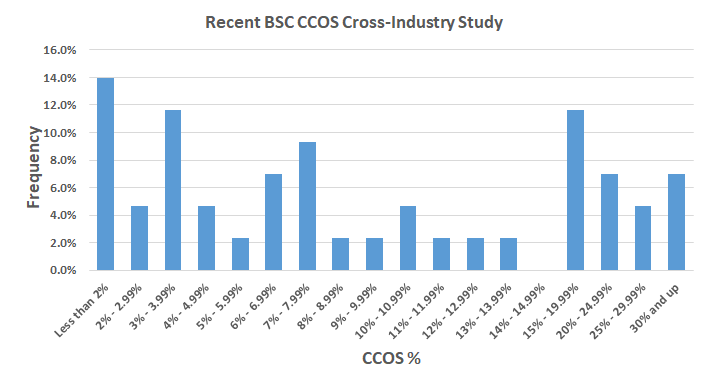
Before providing a definition of Compensation Cost of Sales (CCOS), let me first tell you a familiar story. Whether it comes from an email question to our firm, or a question in an initial client meeting, we are frequently asked: “What’s the average commission rate in our industry?” as if it’s a test of our knowledge and expertise, or some attempt to defend a company’s current plans against some internal attack that their plans are too rich. My favorite answer is “2.4%”, said with much certainty and a wry smile or emoticon if electronic. I often want to reply as Marisa Tomei responded in her Oscar winning performance in “My Cousin Vinny”…”That’s a b&%%$#!+ question.” At the top of this article, we include CCOS results from a recent BSC study. We provide more for a sense of the potential range more than anything else. There is a wide range and benchmarks rarely help. But CCOS is a key metric, so let’s explore more!
Naturally, commission rates vary widely even in similar industries, as well as within a single company, as roles vary (e.g., major or global account roles versus territory or inside sales roles). This is because compensation levels and base salary to incentive ratios typically vary by role, as do the range of expected sales volumes. Try creating an average rate by company, more or less across companies, and you quickly realize how unimportant that comparison actually is. Try selling the comparison to your sales leaders and you’ll be pushed back farther than you may be able to able to recover.
The question companies really seek to ask is how much am I spending on my sales force versus other companies. This too is a challenging concept. Cost of Selling studies are rife with definitional inconsistencies as to what categories of cost to include (sales office building leases, overhead allocation, etc.) as well as whether the denominator should be actual current period revenue, or sales bookings.
Ultimately, the one comparable ratio becomes CCOS, which looks at what current period compensation (base and variable) is as a percentage of current period revenue. This measure is really a productivity measure answering: how much of every dollar do I have to spend to get a dollar of revenue? Naturally, in some businesses, total bookings, or even total gross margins (especially in distribution) may be a better denominator, but for most product based companies, revenue is the best metric. Of critical importance is to use a real financial measure, rather than sales crediting, which can be a distinctly different currency due to modifications in deal values and multiple sales crediting.
CCOS = [Total Salaries Paid + Total Incentives]/Total Revenue
Once calculated, the question becomes how to get data to compare it to. Absent having a benevolent consultant conduct one for free, you can charter a study with comparable companies. But once you get the data, what do you do? Let’s say you find that you are in the 70th percentile of spend….what do you do?
Do you cut pay, increase quotas, or reduce accelerators? Probably not! Assume you’re in the low 30th percentile of spend…now what? Raise pay, add salespeople?
Actually, what you need to do is look internal… deeply internal, and look over time to see trends. A total company CCOS rate is like an average of averages, and an average productivity measure gives you nothing with which to analyze and improve. First, you need to look at the details, segment by segment, as well as region by region. Here, you can identify where you are performing most effectively, and least effectively. Next, you should look at not just last year, or this year’s target; include two years ago, so that you can see a trend. Which segments or regions are improving. This data gives you a chance to look for root causes of increased or decreased effectiveness.
One other cut of CCOS we like to see is new hires versus sellers with at least a year of experience. This can help you examine your investment in incremental headcount growth, and not apply the same treatment to all sellers. This can keep you from burdening legacy employees with extra quota to try and afford new talent.
One last thing to examine is a look at relative performance of each of your segments and regions versus your market. By defining and reviewing the growth rate with the CCOS trends, you can identify where results and effectiveness are best aligned, and of course, where they are not. This can help you understand your relative achievement versus the competition or broad market, and how effective your spend is in reaching those performance levels. The following table shows examples and some conclusions you might make.
This can help you focus your sales management efforts on coaching, training or even talent recruitment to try to drive incremental results. You can also do root cause analysis to see if there are competitive factors hurting or helping you in those specific segments or regions. Lastly, it can help you develop segment specific sales compensation plans and targets that better suit the environment in which the sellers are actually performing, and can better drive their motivation to succeed.

